To increase car wash throughput without buying more land, start by finding the slowest step in the complete customer journey—not by increasing machine speed immediately. Payment, vehicle positioning, wash-program design, drying, exit clearance, small stoppages and rewash can each limit the number of completed vehicles.
The objective is sustainable output: more correctly washed vehicles during the hours when demand exists, without weakening safety margins, chemical dwell, rinse quality, drying performance or preventive maintenance.
Operator rule: optimize the entire vehicle path. A faster wash cycle does not improve site throughput when payment, loading, drying or the exit remains the bottleneck.
Measure completed vehicles before changing equipment settings
Use actual completed washes, not the machine’s theoretical capacity, as the operating baseline. Record data during normal periods and peak demand separately. Averages across the whole day can hide the congestion that costs the most business.
- vehicles arriving, entering and completing the wash;
- completed vehicles per operating hour and per peak interval;
- time from arrival to payment, payment to entry, entry to wash completion and completion to a clear exit;
- average gap between consecutive vehicles or cycles;
- stoppage events, their duration and their cause;
- rewashes, customer complaints and incomplete drying;
- vehicles that leave the queue before purchasing;
- which wash programs customers select during peak periods.
For a single in-bay machine, a simple theoretical reference is 60 divided by the total minutes occupied per vehicle. Real output is lower whenever entry, positioning, payment, faults or exit time are not included. For a tunnel, capacity depends on the validated conveyor setting, safe vehicle spacing, loading discipline and the ability of downstream stages to clear vehicles. Never change safe spacing or equipment limits without approved technical guidance.
Map the full car wash throughput path
| Stage | Typical throughput loss | Evidence to collect | Low-risk first action |
|---|---|---|---|
| Approach and queue | Confusing lanes, blocked access or customers choosing programs late | Queue video, abandoned vehicles and peak arrival pattern | Improve lane guidance, menu visibility and decision points |
| Payment and activation | Slow terminal, too many choices, failed transactions or manual intervention | Transaction time, failure codes and assistance frequency | Simplify the menu and correct recurring payment faults |
| Entry and positioning | Drivers stop incorrectly or require repeated guidance | Entry time, alignment retries and sensor events | Improve signs, lights, markings and operator instructions |
| Wash process | Unnecessary program steps, nozzle or chemical problems, minor stops | Program duration, alarm history, pressure and dosing checks | Restore the approved process before considering program changes |
| Drying | Slow pass, poor air delivery or vehicles waiting for finishing work | Drying time, residual-water pattern and blower condition | Inspect airflow, positioning and the selected drying package |
| Exit | Blocked merge, detailing activity or insufficient stacking space | Time until exit clears and downstream conflicts | Separate finishing tasks and keep the exit path open |
| Availability | Short recurring stoppages or delayed recovery from faults | Downtime log, alarm code, affected component and response time | Prioritize the repeat causes and prepare the correct spares |
Separate cycle time from total occupied time
Operators often measure only the programmed wash cycle. The customer, however, occupies capacity before and after that timer. For an in-bay site, total occupied time may include door movement, vehicle entry, alignment, authorization, the wash sequence, drying, departure and reset for the next vehicle.
Time each part separately for a sample of vehicles. If the machine cycle is consistent but entry varies widely, driver guidance is the first opportunity. If entry is stable but the bay waits after every wash, inspect the exit and reset sequence. This prevents an expensive equipment change from being used to solve a workflow problem.
Improve entry, payment and vehicle positioning
Move decisions upstream
Place clear program names, main benefits, vehicle restrictions and payment instructions where customers can read them before reaching the terminal. A shorter, clearer menu can reduce hesitation without removing profitable options. Keep promotional messages separate from the instructions required to enter safely.
Make correct positioning obvious
Consistent floor markings, traffic lights, signs and multilingual instructions can reduce alignment retries. Review whether drivers can see the guidance at the correct approach angle and whether larger vehicles receive enough warning. Do not bypass sensors or anti-collision logic to save seconds.
Remove recurring terminal interruptions
Group payment failures by cause: connectivity, card reader, code entry, receipt handling, user interface or staff approval. Fixing one repeated interruption may recover more peak capacity than changing the wash program.
Optimize wash programs without reducing wash quality
Program optimization should remove waste, not necessary cleaning. Review whether each program matches the vehicle condition and the price paid. Confirm chemical delivery, high-pressure performance, brush condition where applicable, rinse coverage, vehicle detection and drying before shortening any stage.
- compare programmed time with observed time and investigate unexplained delays;
- check that nozzles, filters and water supply are maintaining the intended process;
- verify dosing and application rather than compensating for weak chemistry with repeated passes;
- use distinct programs for real customer needs instead of minor combinations that slow selection;
- track rewash and complaint rates after any change;
- document the previous settings and change one controlled variable at a time.
Machine settings, chemical ratios and safety logic should remain within the approved equipment and chemical-supplier guidance. If the process cannot reach the desired output without lowering quality, the constraint may require a configuration change rather than a software adjustment.
Treat drying and exit flow as production stages
Drying problems can create two kinds of capacity loss: longer machine time and manual finishing that blocks the exit. Record where water remains, which vehicle types are affected and whether the issue changes with weather or program selection. Inspect blower condition, orientation, vehicle position and air path before simply extending drying time.
Keep vacuuming, towel finishing, inspection and customer discussions away from the wash exit whenever the property allows. A vehicle that has completed the machine process but cannot leave still occupies site capacity.
Recover throughput by reducing small stoppages
One major breakdown is visible; repeated two- or three-minute interruptions are easier to accept and therefore often remain unresolved. Maintain a simple downtime log with the time, alarm, symptom, affected program, action taken and part used. Rank causes by total minutes lost, not only by the number of incidents.
| Priority | Operator action | Expected operational value |
|---|---|---|
| Restore basic condition | Cleaning, inspection, lubrication and approved adjustment | Prevents avoidable sensor, motion and fluid-delivery interruptions |
| Prepare first-line diagnosis | Train staff to record alarms, photos and operating conditions | Shortens communication and avoids repeated troubleshooting |
| Plan critical spares | Identify model-specific wear and downtime-sensitive components | Reduces waiting when the correct part is confirmed |
| Review repeat faults | Escalate recurring symptoms with complete records | Addresses the root cause instead of resetting indefinitely |
Use the installation and after-sales support framework to plan documentation, operator training, remote assistance and spare-parts responsibilities for a selected system.
Use a simple throughput dashboard
A mature operation does not need a complicated analytics platform to begin. Review a short set of indicators every week and compare peak periods with quieter periods.
- Completed vehicles per peak hour: the output customers actually received.
- Availability: scheduled operating time minus unplanned downtime.
- Total occupied time: entry through a clear exit, not just the wash timer.
- Rewash rate: a quality check that prevents speed from hiding poor results.
- Payment or loading exceptions: transactions or entries requiring staff help.
- Queue abandonment: visible lost demand during busy periods.
These indicators can be combined into a diagnostic model similar to availability × performance × quality, but the value is in consistent definitions and trends—not in claiming one universal benchmark for every site.
When does higher throughput require an equipment change?
Operational improvements should come first when the main delay is payment, guidance, poor maintenance or blocked exit flow. Consider equipment reconfiguration, retrofit or replacement when the verified constraint is inside the process and remains after restoring correct operation.
- current control or payment systems cannot support the required operating model;
- drying capacity consistently limits the approved wash sequence;
- the equipment cannot accommodate the actual vehicle mix;
- repeat component or control faults make availability unacceptable;
- the existing in-bay format cannot meet sustained demand and the site can support a different configuration;
- local service and parts for the current equipment are no longer practical.
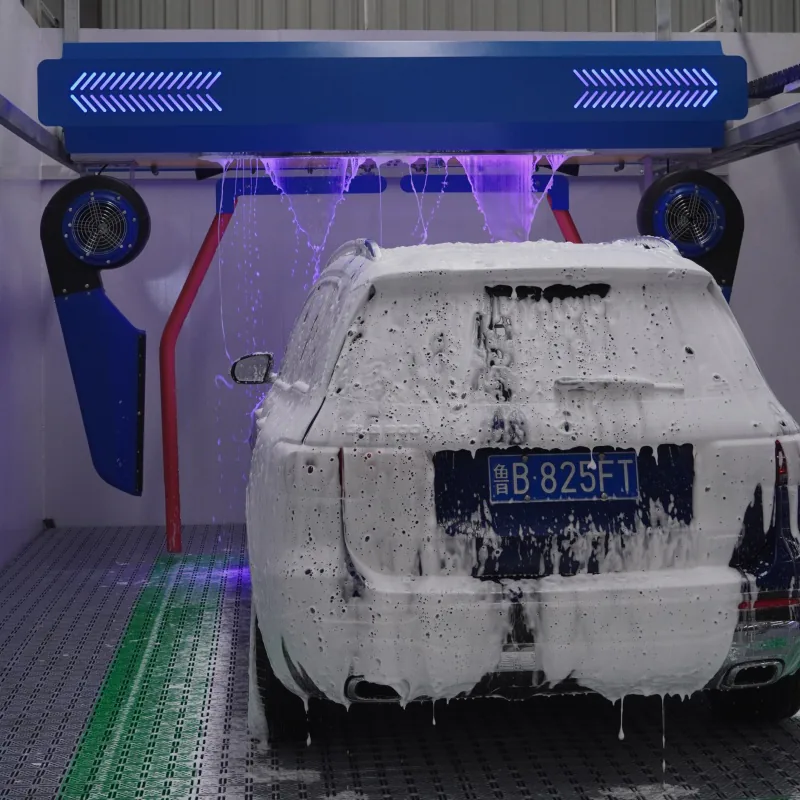
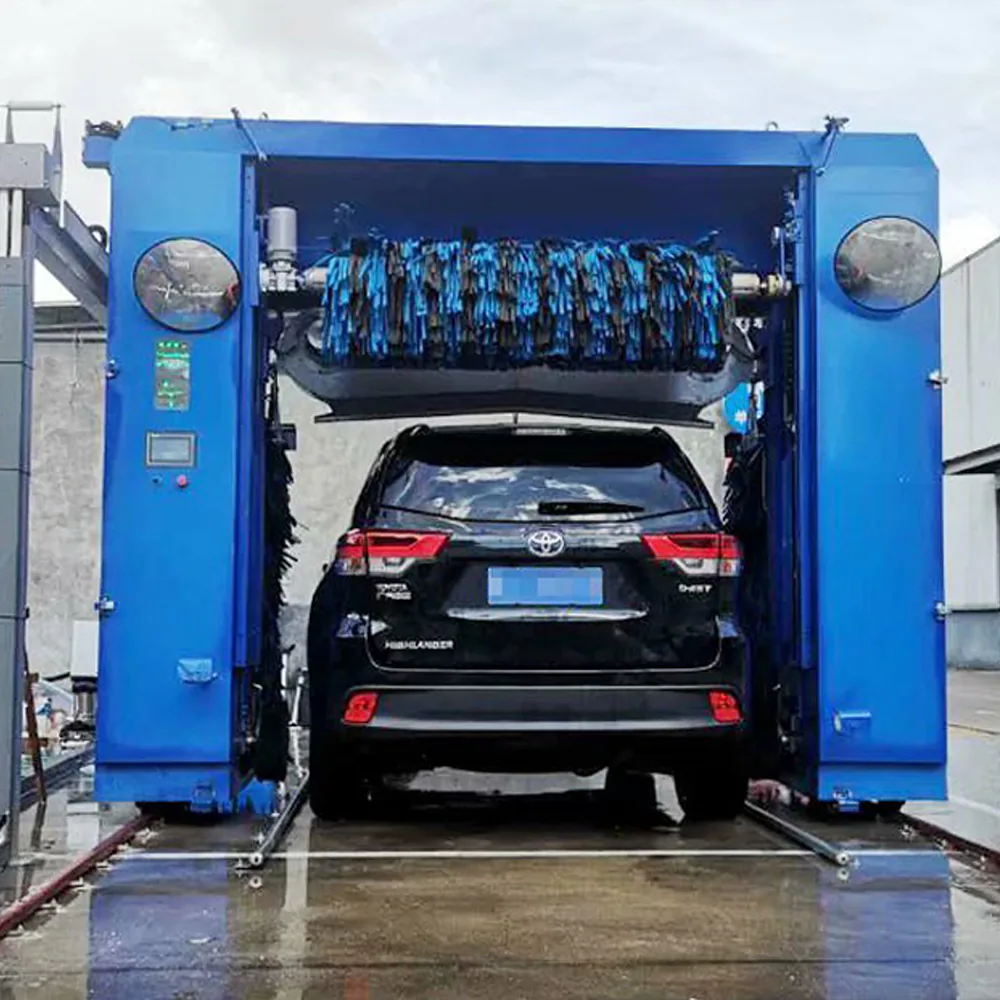
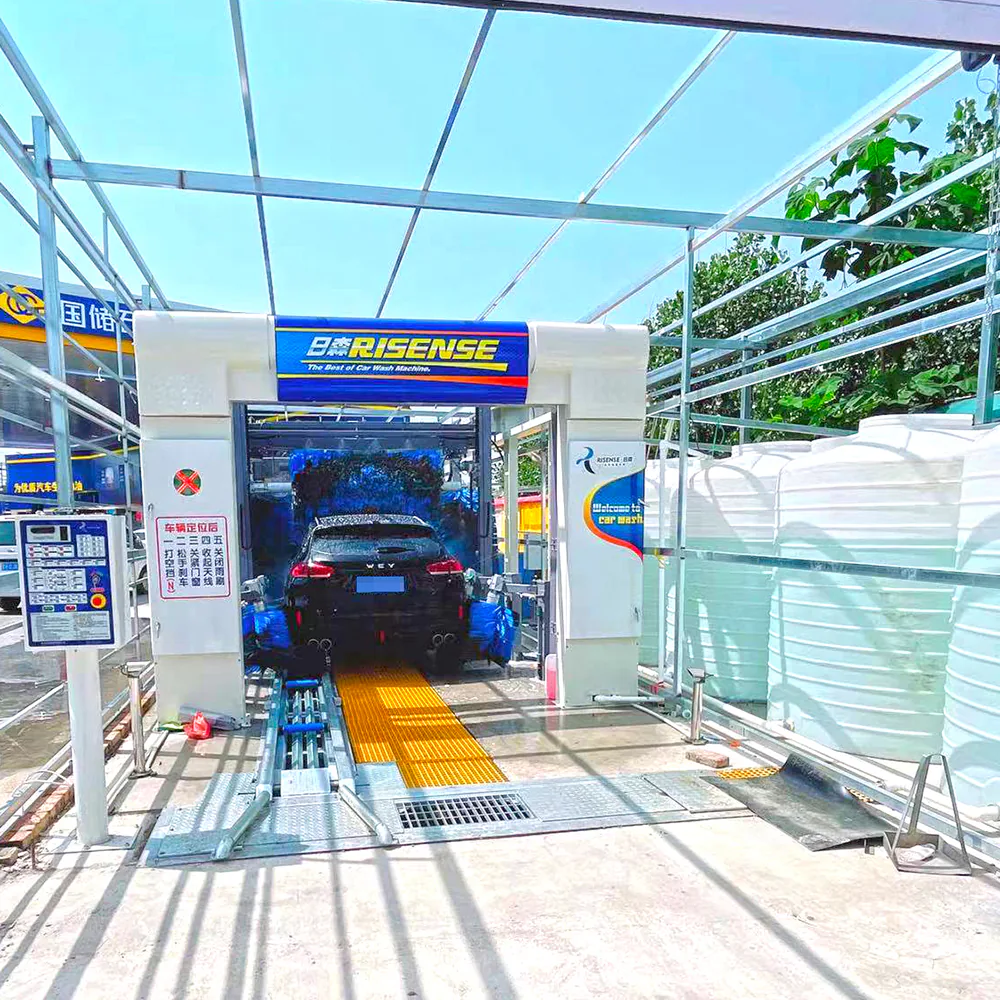
Compare the current operation with touchless, rollover and tunnel car wash systems. A tunnel may support continuous flow at an appropriate site, while a well-configured in-bay system may remain the better choice where land, traffic or staffing is constrained.
A 30-day car wash throughput improvement plan
- Week 1 — establish the baseline. Count completed vehicles and time each stage during normal and peak demand.
- Week 2 — remove obvious waiting. Improve signs, menu decisions, staff roles, entry guidance and exit clearance.
- Week 3 — restore equipment condition. Resolve repeated alarms, maintenance gaps, fluid-delivery problems and drying issues.
- Week 4 — test one controlled change. Compare output, downtime, rewash and customer complaints with the original baseline.
The plan is a diagnostic framework, not a guaranteed output increase. Demand, site geometry, vehicle mix, weather, wash program and equipment condition all influence the result.
Information to prepare for a throughput review
- current machine type, model, age and main configuration;
- site drawing or dimensions, entrance, queue and exit photographs;
- completed vehicles by hour for representative days;
- wash programs and observed total occupied time;
- fault, maintenance and parts-replacement history;
- vehicle mix and the most common wash-quality complaints;
- payment method, staffing model and peak queue behavior;
- local voltage, water supply, drainage and any expansion constraints.
YOLO Car Wash Systems can review these inputs when discussing an equipment upgrade or a new operating configuration. Explore the throughput optimization solution, then send measured site information for a project-specific discussion.