Top Cities, Vehicle Fleet, Growth Trends & Investment Opportunities
A data-driven guide for investors evaluating new car wash businesses in Brazil
Brazil is one of Latin America's largest automotive markets, with more than 214 million residents and more than 133 million registered vehicles in 2026.
But national statistics alone do not tell an investor where to build a successful car wash.
The more important question is:
Where are the vehicles, where is the vehicle fleet growing, and where can a new car wash still find enough demand?
This report provides a city-level framework for evaluating car wash opportunities across Brazil using official data from SENATRAN and IBGE.
The analysis focuses on:
- Population
- Registered vehicle fleet
- Passenger-car concentration
- Vehicles per 100 residents
- Fleet growth
- Population growth
- Market scale
- Competition
- Potential car wash business models
The objective is not to declare one city as the "best" market.
Instead, the objective is to help investors identify cities and locations that deserve further feasibility analysis.
Brazil at a Glance
| Indicator | 2026 |
|---|---|
| Population | 214.2 million |
| Municipalities | 5,500+ |
| Registered vehicles | 133.3 million+ |
| Registered vehicles per 100 residents | ~62 |
| Latest SENATRAN municipal fleet data | September 2026 |
| Latest IBGE municipal population estimates | July 2026 |
IBGE estimates Brazil's 2026 population at approximately 214.2 million people. The estimate is based on July 1, 2026 and is available at the municipal level.
SENATRAN's latest published municipal fleet dataset covers September 2026 and provides vehicle counts by municipality and vehicle type.
A recent analysis using the September 2026 SENATRAN dataset calculated approximately 133.34 million registered vehicles nationwide, equivalent to about 62.2 registered vehicles per 100 residents.
These numbers demonstrate the scale of the Brazilian automotive market.
However, registered vehicles should be treated as a market indicator, not as the number of vehicles that actually visit commercial car washes.
1. Why Brazil Is an Interesting Car Wash Market
A large vehicle fleet creates a substantial potential customer base for vehicle cleaning and maintenance services.
However, the opportunity is not evenly distributed.
Brazil contains:
- enormous metropolitan areas;
- rapidly growing regional cities;
- agricultural and logistics centers;
- coastal tourism markets;
- industrial cities;
- suburban municipalities surrounding major capitals.
These markets have very different vehicle ownership patterns.
For a car wash investor, this creates an important opportunity:
The next successful car wash does not necessarily need to be built in Brazil's largest city.
A smaller regional city with a high vehicle-to-population ratio and limited professional competition may offer better economics than a much larger metropolitan market.
2. Registered Vehicles Are Not the Same as Car Wash Demand
Before looking at city rankings, one distinction is critical.
SENATRAN's vehicle fleet includes many categories:
- Automobiles
- Motorcycles
- Mopeds
- Pickup trucks
- Utility vehicles
- Trucks
- Buses
- Trailers
- Other vehicles
A motorcycle does not generate the same automatic car wash demand as a passenger car.
Likewise, a registered truck may have a completely different washing pattern from a privately owned SUV.
Therefore, this report separates the concepts of:
Total Vehicle Fleet
Useful for understanding the overall motorization of a city.
Passenger-Car Fleet
More directly relevant to consumer automatic car wash demand.
Light Commercial Vehicles
Potentially important for commercial and fleet washing.
Motorcycles
Important for the broader vehicle-service market, but not directly comparable with passenger-car washing demand.
This distinction prevents a common analytical mistake:
A city with more registered vehicles is not automatically a city with more car wash customers.
3. Brazil's Largest Population Markets
Brazil's largest urban markets remain important because they provide enormous potential customer bases.
Examples of major population centers include:
| City | State | Approx. 2025 Population |
|---|---|---|
| São Paulo | SP | 11.9M |
| Rio de Janeiro | RJ | 6.7M |
| Brasília | DF | 3.0M |
| Fortaleza | CE | 2.6M |
| Salvador | BA | 2.6M |
| Belo Horizonte | MG | 2.4M |
| Manaus | AM | 2.3M |
| Curitiba | PR | 1.8M |
| Recife | PE | 1.6M |
| Goiânia | GO | 1.5M |
| Belém | PA | 1.4M |
| Porto Alegre | RS | 1.4M |
| Guarulhos | SP | 1.3M |
| Campinas | SP | 1.2M |
IBGE's municipal population estimates provide the official basis for comparing Brazilian cities.
These cities represent large demand pools, but population alone should not determine an investment decision.
4. The More Useful Indicator: Vehicles per 100 Residents
One of the simplest ways to compare cities is:
Vehicle Ownership Density
Registered Vehicles ÷ Population × 100
For example:
If a city has:
- 500,000 residents
- 300,000 registered vehicles
then:
300,000 ÷ 500,000 × 100 = 60 vehicles per 100 residents
This means there are approximately 60 registered vehicles for every 100 residents.
The indicator is useful because it normalizes cities of different sizes.
A city with 200,000 residents and 140,000 registered vehicles may actually have a stronger automotive market relative to its population than a city with 2 million residents and 800,000 vehicles.
5. But Vehicle Density Has an Important Limitation
Vehicle density should not be interpreted as actual vehicle usage.
A vehicle may:
- be registered in one municipality but used elsewhere;
- rarely be driven;
- remain parked for long periods;
- belong to a fleet;
- have been sold but not yet removed from registration records.
SENATRAN's municipal data therefore measures registered vehicles, not daily traffic.
This is why a serious investment analysis should combine fleet statistics with:
- traffic counts;
- road accessibility;
- local population;
- income;
- commercial development;
- competitor locations;
- land costs.
6. A New Way to Rank Brazilian Car Wash Markets
Instead of ranking cities solely by fleet size, we propose a:
Brazil Car Wash Opportunity Index
The index combines five factors.
| Factor | Weight |
|---|---|
| Passenger vehicle market size | 30% |
| Vehicle ownership density | 20% |
| Fleet growth | 20% |
| Population growth | 10% |
| Competition / market saturation | 20% |
Each city receives a score from 0–100.
Market Size
Measures the absolute number of potential passenger vehicles.
Vehicle Density
Measures the concentration of vehicles relative to population.
Fleet Growth
Measures whether the number of vehicles is increasing.
Population Growth
Measures whether the potential customer base is expanding.
Competition
Measures how difficult it may be for a new operator to capture demand.
7. Why the Largest City May Not Be the Best Investment
São Paulo is the clearest example.
The city passed 10 million registered vehicles in 2026, according to data from SENATRAN. By July, the fleet had reached approximately 10.1 million vehicles.
That is an enormous automotive market.
But a large fleet also attracts:
- established car washes;
- franchise operators;
- detailing businesses;
- fuel-station car washes;
- mobile washing services;
- automated systems.
Therefore:
Market Size: Extremely High
but potentially:
Competition: Extremely High
This is why the Opportunity Index does not simply rank São Paulo first and stop there.
For a new investor, a secondary city may provide a better balance between demand and competition.
8. Secondary Cities Can Be Particularly Interesting
The Brazilian market contains a large number of regional cities that have:
- hundreds of thousands of residents;
- substantial vehicle fleets;
- growing suburbs;
- commercial development;
- major highways;
- fuel stations;
- shopping centers;
- industrial activity.
These markets can sometimes provide a better environment for a new automatic car wash.
Examples of cities that deserve detailed investigation include:
São Paulo State
- Campinas
- São José dos Campos
- Ribeirão Preto
- Sorocaba
- Santos
- São José do Rio Preto
- Piracicaba
Paraná
- Curitiba
- Londrina
- Maringá
- Cascavel
- Ponta Grossa
Santa Catarina
- Florianópolis
- Joinville
- Blumenau
- Itajaí
- Chapecó
Goiás / Center-West
- Goiânia
- Anápolis
- Campo Grande
- Cuiabá
Minas Gerais
- Belo Horizonte
- Uberlândia
- Contagem
- Juiz de Fora
- Uberaba
These cities should be viewed as candidate markets, not guaranteed investment recommendations.
The next step is to compare their actual vehicle fleet, growth and competition.
9. Growth Can Be More Important Than Current Size
A city with 1 million vehicles today may be attractive.
But a city with 600,000 vehicles growing rapidly can become equally interesting over a five-year investment horizon.
For this reason, we recommend calculating:
Fleet Growth Rate
(Current Fleet − Previous Fleet) ÷ Previous Fleet × 100
SENATRAN publishes monthly municipal fleet data, allowing investors to compare different periods. The current 2026 dataset is available through September.
For example, a city could have:
| Indicator | City A | City B |
|---|---|---|
| Current fleet | 800,000 | 500,000 |
| Annual growth | 1% | 6% |
| Competition | High | Moderate |
City A is larger.
But City B may have a more attractive growth profile.
This is why a good investment model needs both scale and momentum.
10. Example: A High-Motorization Regional Market
Some smaller Brazilian cities have exceptionally high numbers of registered vehicles relative to population.
For example, recent analysis of September 2026 SENATRAN data found that Luís Eduardo Magalhães, Bahia, had approximately 92,751 registered vehicles, equivalent to 77.3 vehicles per 100 residents. Barreiras had approximately 113,274 vehicles, or 65.7 vehicles per 100 residents.
These cities illustrate an important investment concept.
Neither is remotely comparable with São Paulo in absolute population.
Yet their vehicle ownership density is extremely high.
This means that investors should not restrict their search to Brazil's largest metropolitan areas.
11. Population Growth Creates Long-Term Potential
IBGE's 2026 estimates allow investors to compare the current population of Brazilian municipalities.
However, there is an important methodological limitation:
IBGE does not publish municipal population projections.
IBGE publishes annual municipal population estimates, while official population projections are produced for Brazil and the Federation Units rather than individual municipalities.
Therefore, a 2030 city population number should not be presented as an official IBGE forecast.
Instead, investors can create their own scenarios.
12. Estimating the Future Vehicle Fleet
A simple scenario model can be used to estimate future vehicle demand.
Conservative Scenario
Annual fleet growth:
1%
Base Scenario
Annual fleet growth:
2%
High-Growth Scenario
Annual fleet growth:
4%
The formula is:
Future Fleet = Current Fleet × (1 + Growth Rate)^Years
Suppose a city currently has:
500,000 passenger vehicles
Then by 2030:
| Scenario | Annual Growth | 2030 Fleet |
|---|---|---|
| Conservative | 1% | ~520,000 |
| Base | 2% | ~541,000 |
| High Growth | 4% | ~584,000 |
These are investment scenarios, not official forecasts.
A stronger model should use the city's actual SENATRAN historical fleet data to calculate its own growth rate.
13. From Vehicle Fleet to Potential Car Wash Demand
The next step is to estimate how much of the vehicle fleet could potentially use professional washing services.
We recommend avoiding an unsupported statement such as:
"Every car will be washed twice per month."
Instead, investors should model several utilization scenarios.
For example:
Low Utilization
5% of vehicles use the commercial wash each month.
Base Utilization
10% use the commercial wash each month.
High Utilization
15% use the commercial wash each month.
If a city has:
500,000 passenger vehicles
then the estimated monthly addressable market would be:
| Scenario | Monthly Vehicles |
|---|---|
| 5% | 25,000 |
| 10% | 50,000 |
| 15% | 75,000 |
This does not mean a new car wash will capture these vehicles.
Instead, it represents a theoretical market-size range before competition and customer behavior are considered.
14. Competition Is the Missing Variable
Vehicle statistics tell us about potential supply and demand.
They do not tell us whether the market is already saturated.
Two cities could have:
500,000 passenger vehicles
but completely different investment environments.
City A
- 500,000 vehicles
- 150 professional car washes
- strong established brands
- high land costs
City B
- 500,000 vehicles
- 50 professional car washes
- growing suburbs
- several high-traffic corridors
City B could offer a much better opportunity.
Therefore, the next stage of the Brazil Car Wash Opportunity Index should include:
Car Washes per 100,000 Passenger Vehicles
This is one of the most useful indicators for future versions of the report.
15. The Car Wash Competition Ratio
We propose:
Competition Ratio = Number of Professional Car Washes ÷ Passenger Vehicle Fleet × 100,000
For example:
City A:
- 500,000 passenger vehicles
- 150 car washes
Competition ratio:
30 car washes / 100,000 vehicles
City B:
- 500,000 passenger vehicles
- 50 car washes
Competition ratio:
10 car washes / 100,000 vehicles
This does not prove City B will be more profitable.
But it provides a much better starting point for site selection than vehicle fleet size alone.
16. What Makes a City Attractive for a New Car Wash?
We recommend looking for the following combination:
Large Passenger Vehicle Base
Enough vehicles to support a meaningful customer pool.
High Vehicle Density
Strong vehicle ownership relative to population.
Positive Fleet Growth
More vehicles entering the market over time.
Population Growth
An expanding potential customer base.
Moderate Competition
Enough demand remaining for a new operator.
Strong Traffic
Vehicles actually passing potential sites.
Suitable Commercial Land
Enough space for the intended equipment and customer flow.
This combination is much more meaningful than simply asking:
"Which Brazilian city has the most cars?"
17. Different Markets Need Different Car Wash Systems
The opportunity analysis should ultimately influence equipment selection.
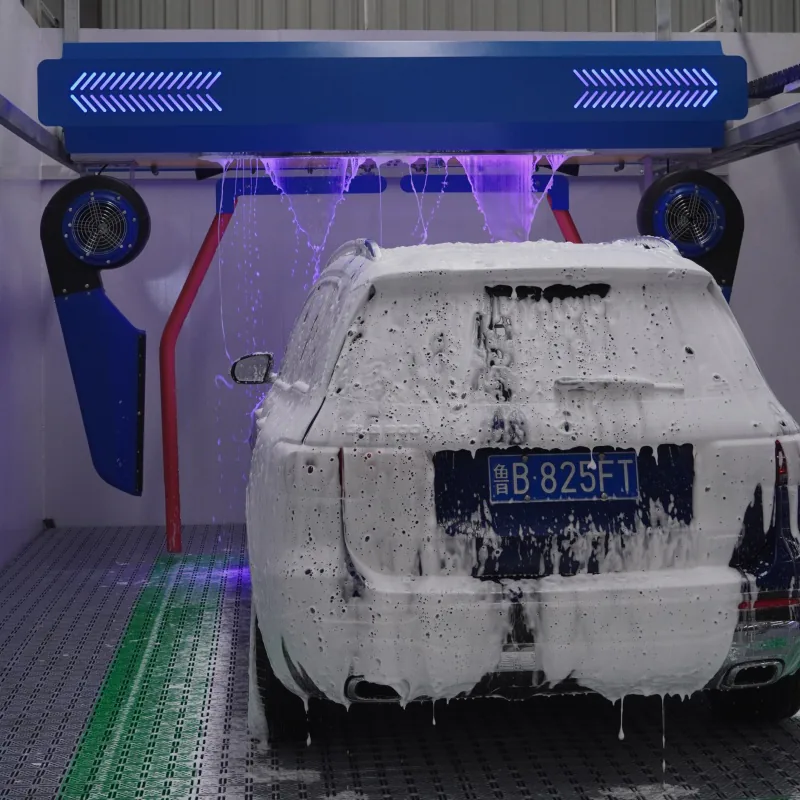
Touchless In-Bay
A touchless system can be attractive for:
- compact sites;
- automated operations;
- fuel stations;
- operators looking for a low-contact washing model.
It can provide a relatively compact solution where land availability is limited.
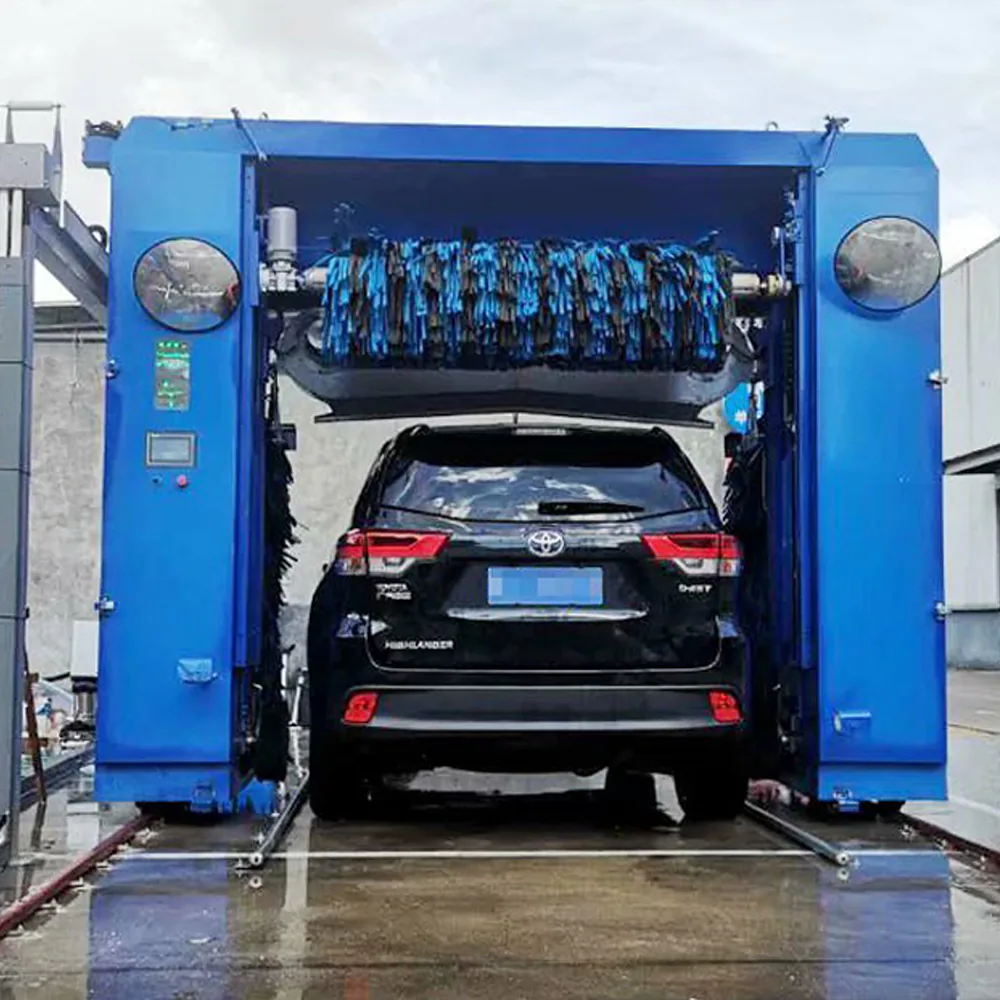
Rollover
Rollover systems can be suitable for:
- gas stations;
- independent car wash businesses;
- smaller commercial sites;
- moderate vehicle volumes.
The vehicle remains stationary while the washing machine moves around it.
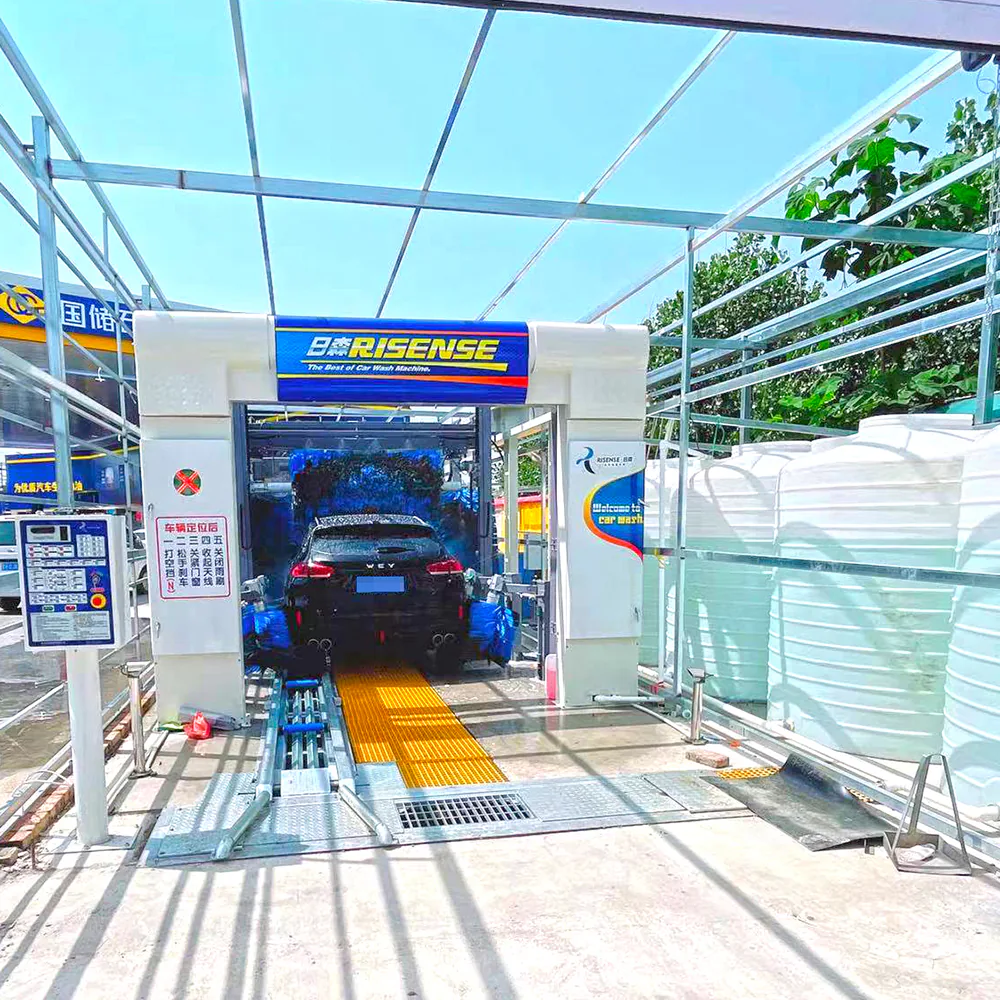
Tunnel
Tunnel systems are designed for higher throughput.
They may be appropriate when a location has:
- very high traffic;
- sufficient land;
- strong vehicle demand;
- efficient queue management;
- adequate entrance and exit space.
A tunnel should not be selected simply because a city has a large population.
It should be selected because the site can generate enough vehicle throughput.
18. City Opportunity ≠ Site Opportunity
This is perhaps the most important conclusion of this report.
A city can have:
1 million passenger vehicles
and still contain a poor location for a new car wash.
The final site analysis should consider:
Traffic
How many vehicles pass the location?
Visibility
Can drivers see the business early enough to make a decision?
Accessibility
Can customers enter and leave easily?
Nearby Demand Generators
Look for:
- gas stations;
- shopping centers;
- supermarkets;
- automotive dealerships;
- residential developments;
- office districts;
- logistics centers.
Competition
Map competing car washes within the relevant driving radius.
Utilities
Check:
- electricity;
- water;
- drainage;
- wastewater;
- local regulations.
Land
Confirm that the site can accommodate:
- equipment;
- queueing;
- entrance;
- exit;
- drying area;
- payment area;
- customer circulation.
19. The Ideal Investment Screening Model
A practical investor can use the following process.
Stage 1 — National Screening
Compare Brazilian states and regions using:
- vehicle fleet;
- passenger vehicle fleet;
- population;
- vehicle density;
- fleet growth.
Stage 2 — City Screening
Select cities with:
- sufficient vehicle volume;
- high vehicle density;
- positive growth;
- suitable economic conditions.
Stage 3 — Competition Analysis
Map:
- existing automatic car washes;
- self-service washes;
- detailing centers;
- fuel-station washes;
- tunnel systems.
Stage 4 — Site Analysis
Evaluate:
- traffic;
- visibility;
- access;
- land;
- utilities;
- nearby businesses.
Stage 5 — Equipment Selection
Choose:
- Touchless In-Bay;
- Rollover;
- Tunnel;
based on expected throughput and site constraints.
Stage 6 — Financial Model
Estimate:
Daily vehicles × Average ticket × Operating days
Then subtract:
- labor;
- electricity;
- water;
- chemicals;
- rent;
- maintenance;
- taxes;
- financing;
- marketing.
Only after these steps should an investor make a final investment decision.
20. Brazil Car Wash Opportunity Matrix
The following framework can be used to classify potential markets.
| Market Type | Fleet | Growth | Competition | Recommended Focus |
|---|---|---|---|---|
| Major Metro | Very High | Low–Moderate | High | Site selection |
| Fast-Growing Regional City | High | High | Moderate | Strong candidate |
| High-Motorization Small City | Moderate | Moderate–High | Low–Moderate | Rollover / Touchless |
| Mature City | High | Low | High | Differentiation |
| Emerging City | Moderate | High | Low | Early entry |
This is more useful than a simple "Top 10 cities" list because it recognizes that different investment strategies can succeed in different markets.
21. Recommended Cities for Further Investigation
Based on population scale, automotive importance, regional economic activity and growth characteristics, the following cities and metropolitan markets deserve further analysis:
Tier A — Major Automotive Markets
São Paulo
Rio de Janeiro
Brasília
Belo Horizonte
Curitiba
Porto Alegre
Goiânia
Fortaleza
Salvador
Recife
These markets provide large potential demand but generally require careful competition and site analysis.
Tier B — Regional Growth Markets
Campinas
Florianópolis
Joinville
São José dos Campos
Ribeirão Preto
Londrina
Maringá
Campo Grande
Cuiabá
Uberlândia
These markets can offer an attractive combination of population, vehicle ownership and regional economic activity.
Tier C — Emerging Markets
The most interesting emerging markets may be smaller cities where:
- vehicle ownership is high;
- fleet growth is strong;
- population is growing;
- commercial development is expanding;
- professional car wash competition remains limited.
The Opportunity Index is designed specifically to identify these markets rather than automatically favoring Brazil's largest cities.
22. A Real-World Example: São Paulo vs. Regional Markets
Consider two different investment strategies.
Strategy A — São Paulo
Advantages:
- enormous vehicle fleet;
- large population;
- strong purchasing power;
- extensive traffic.
Challenges:
- strong competition;
- expensive land;
- difficult site selection;
- congestion;
- established operators.
Strategy B — Regional Growth City
Advantages:
- lower land costs;
- growing vehicle fleet;
- growing population;
- potentially lower competition;
- easier access to suitable commercial sites.
Challenges:
- smaller absolute market;
- potentially lower average ticket;
- smaller labor pool;
- potentially lower demand for premium services.
Neither strategy is automatically superior.
The correct choice depends on the project economics.
23. What the Data Can — and Cannot — Tell Investors
The Data Can Tell You:
- how many vehicles are registered;
- how the fleet changes over time;
- how large the population is;
- how vehicle density compares between cities;
- whether a market deserves further investigation.
The Data Cannot Tell You:
- exactly how many vehicles are washed professionally;
- how often each vehicle is washed;
- how many customers will choose a new car wash;
- whether a particular site has sufficient traffic;
- whether customers will accept the planned price;
- whether the project will be profitable.
Those questions require local market research.
Therefore, this report should be used as a market-screening tool, not as a substitute for a professional feasibility study.
24. Data Sources
SENATRAN — Brazilian National Traffic Authority
SENATRAN publishes monthly vehicle fleet statistics.
The September 2026 release provides:
- fleet by state and vehicle type;
- fleet by municipality and vehicle type;
- municipality-level data by manufacturing year and model;
- fuel;
- color;
- power;
- restrictions;
- make and model;
- vehicle type, species and axles.
This makes SENATRAN one of the most useful official data sources for analyzing the Brazilian automotive market.
IBGE — Brazilian Institute of Geography and Statistics
IBGE publishes annual population estimates for Brazilian municipalities.
The 2026 estimates use July 1, 2026 as the reference date and cover municipalities throughout Brazil.
25. Methodology
This report combines public data from SENATRAN and IBGE.
Vehicle Density
Registered Vehicles ÷ Population × 100
Fleet Growth
(Current Fleet − Previous Fleet) ÷ Previous Fleet × 100
Future Fleet Scenario
Current Fleet × (1 + Growth Rate)^Years
Opportunity Index
A weighted combination of:
- market size;
- vehicle density;
- fleet growth;
- population growth;
- competition.
The Opportunity Index should be treated as a screening methodology rather than a prediction of investment returns.
26. Important Data Disclaimer
SENATRAN statistics represent vehicles registered in each municipality.
They do not necessarily represent:
- vehicles physically circulating in the municipality;
- the residence of vehicle owners;
- daily traffic;
- vehicles currently operating;
- vehicles that regularly use professional car washes.
Likewise, IBGE municipal population estimates are estimates rather than forecasts.
Future vehicle fleet numbers presented in scenario models are analytical estimates created from explicit assumptions, not official government projections.
Investors should conduct a local feasibility study before making investment decisions.
27. The Next Step: From Market Data to a Specific Site
National and city-level data can answer:
Where should I look?
Site analysis answers:
Where should I build?
For a potential project, investors should collect:
- city;
- exact site location;
- estimated daily traffic;
- land area;
- frontage;
- nearby businesses;
- competitor locations;
- expected daily washes;
- target price;
- available utilities.
The equipment configuration can then be selected based on the expected operating volume.
About YOLO Car Wash Systems
YOLO Car Wash Systems provides commercial car wash equipment and project solutions for international markets.
Our equipment portfolio includes:
- Touchless In-Bay Car Wash Systems
- Rollover Car Wash Systems
- Tunnel Car Wash Systems
For investors planning a new car wash project in Brazil or elsewhere in Latin America, the right equipment should be selected based on the market, site and expected vehicle volume.
Planning a Car Wash Project in Brazil?
Tell us your:
- city;
- site location;
- available land;
- expected vehicle volume;
- project type.
Our team can help you evaluate the appropriate car wash system for your project.